Most Used Indicators for Crypto Trading
Among the thousands of free and widely used technical indicators, there are a few that stand out. They are simple, straightforward and easy to understand, which has made them popular among traders. However, they have many shortcomings. In essence, all indicators are lagging; they rely solely on historical data. Here is a brief overview of the most popular indicators:
Bollinger Bands
Bollinger Bands are a popular technical indicator used to measure volatility and identify potential price reversals.
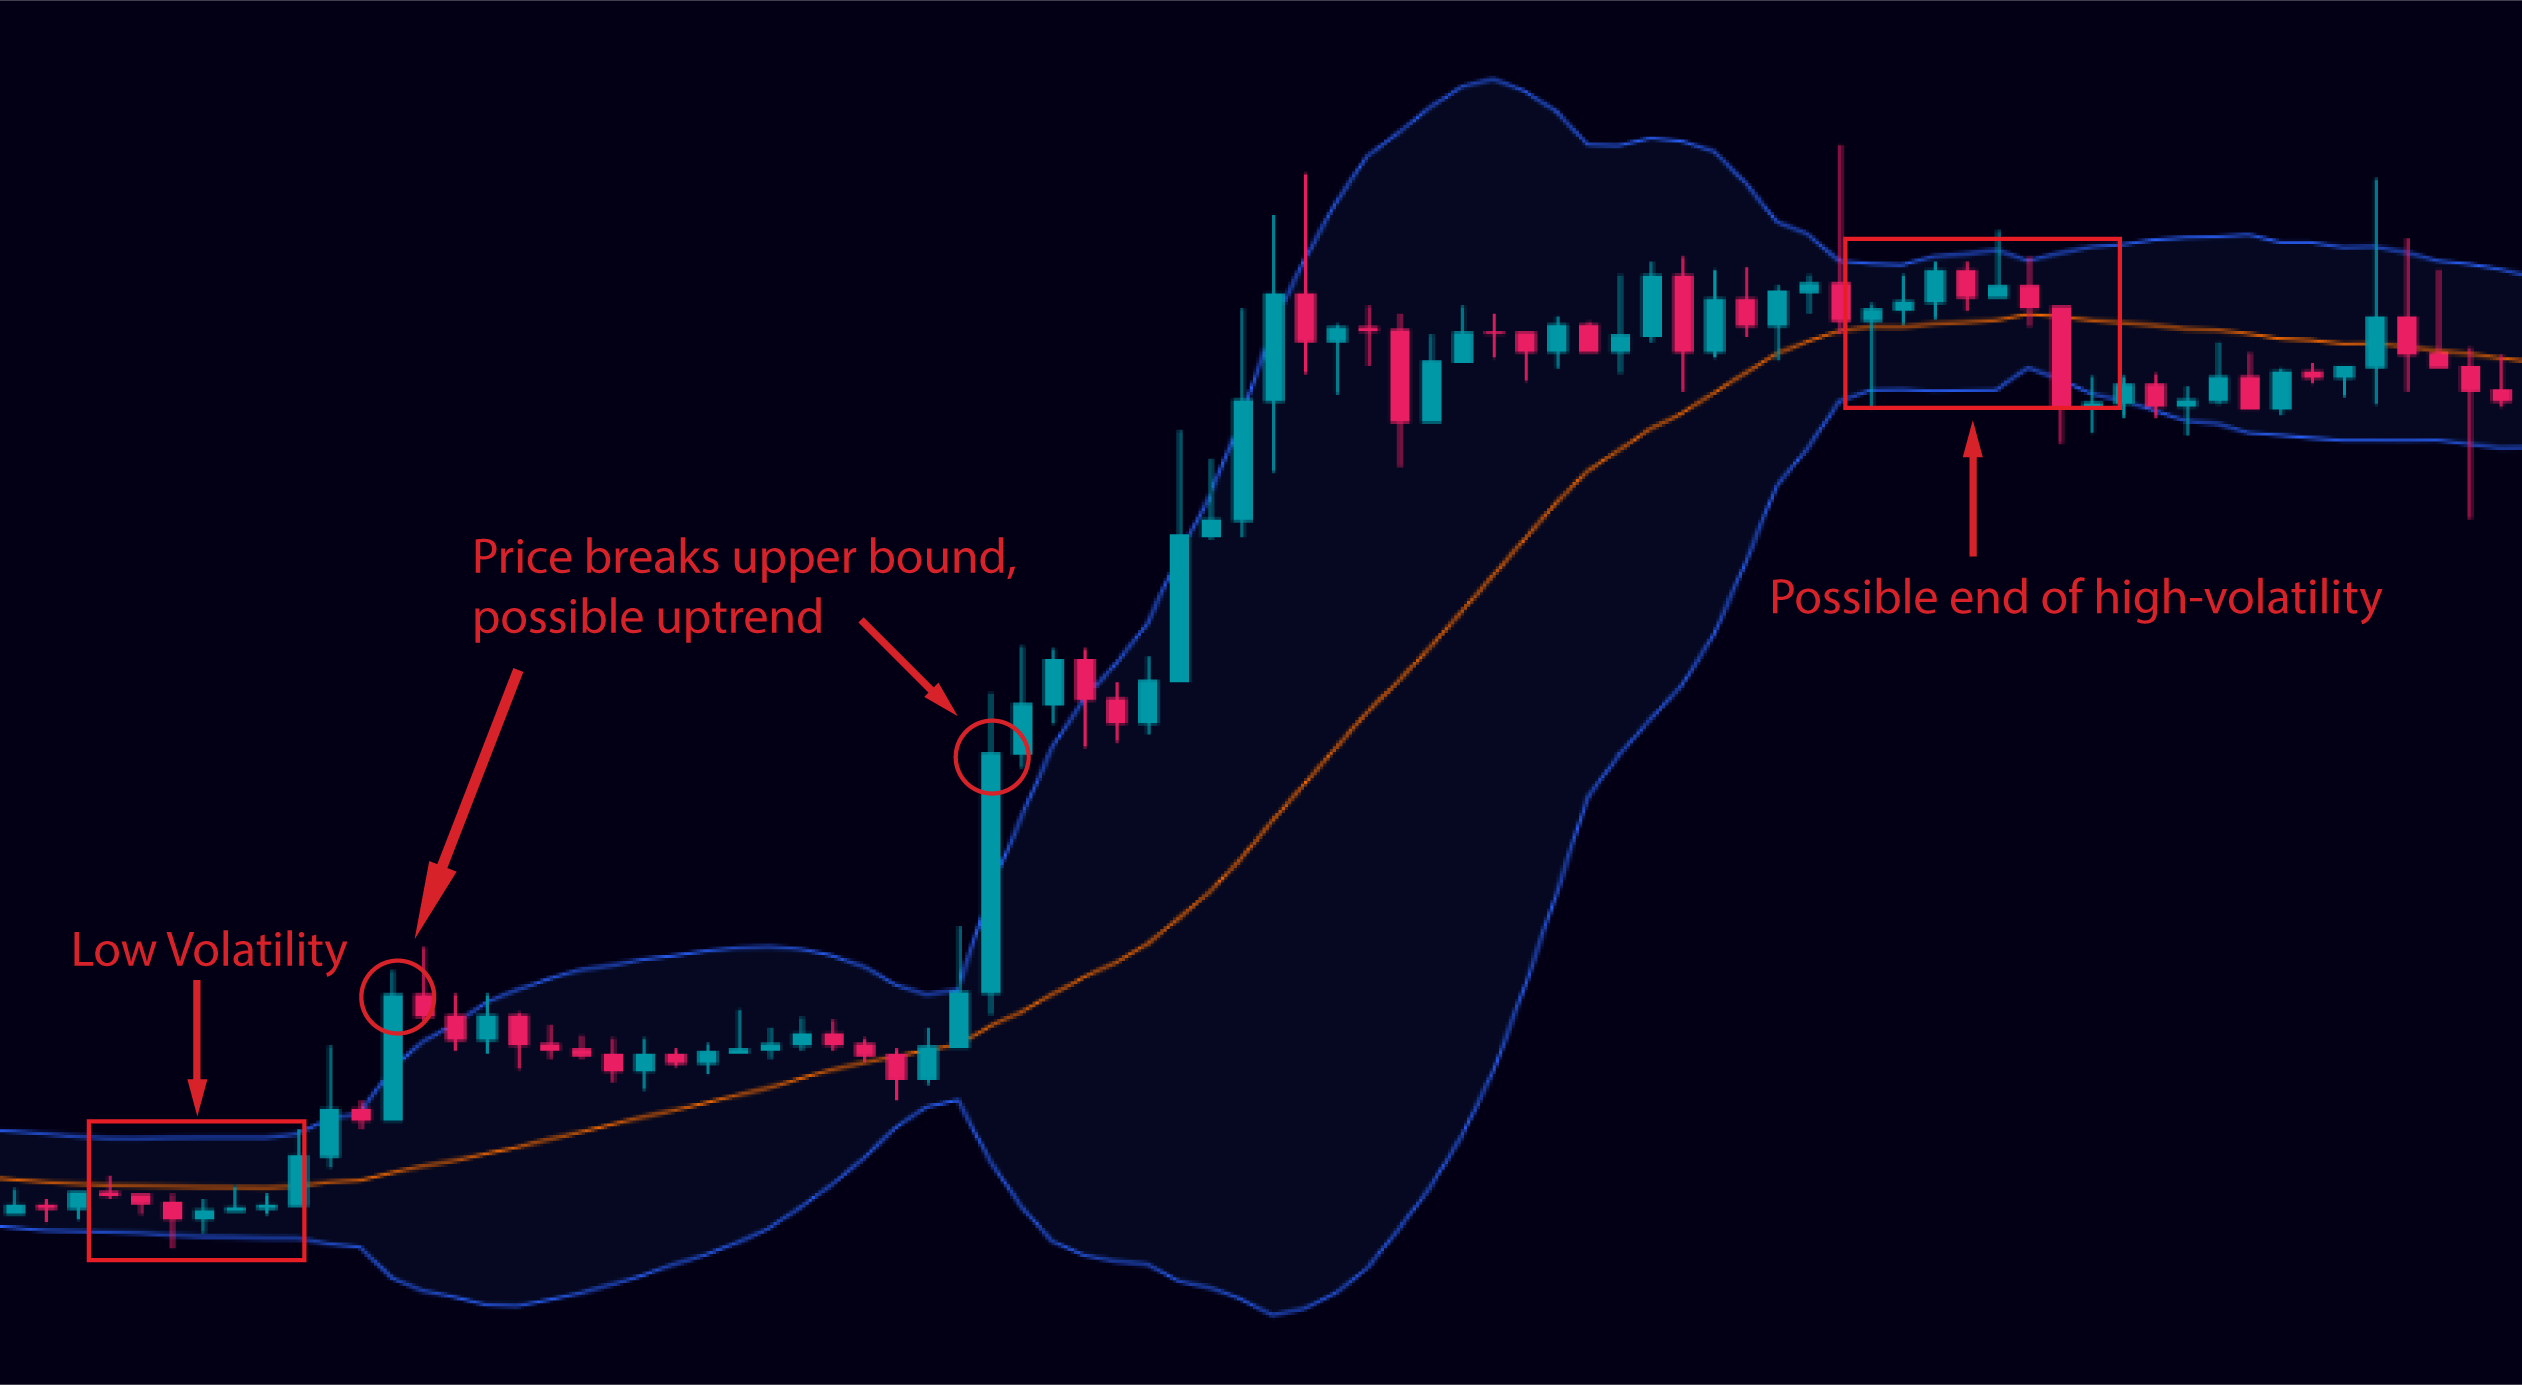 They consist of three lines: a middle line representing the moving average, and an upper and lower band that dynamically adjust based on market volatility. When the price moves towards the upper band, it may indicate overbought conditions, while moves towards the lower band can suggest oversold conditions.
- Traders often use Bollinger Bands to assess potential breakouts or to determine when a market is ranging.
Ichimoku Cloud
The Ichimoku Cloud is a comprehensive indicator providing traders with robust insights into market trends, momentum, and potential support and resistance levels. Developed by Goichi Hosoda, this indicator provides a snapshot of market equilibrium and potential price action at a glance.
- It consists of five lines: Tenkan-sen, Kijun-sen, Senkou Span A, Senkou Span B, and Chikou Span, creating a "cloud" which helps traders identify areas of support and resistance, trend direction, and potential entry and exit points.
- When the price is above the cloud, it signals a bullish trend, suggesting potential buying opportunities. Conversely, when the price is below the cloud, it indicates a bearish trend, pointing to possible selling opportunities.
- A cloud crossover, where Senkou Span A crosses Senkou Span B, can signal a trend reversal. A bullish crossover occurs when Senkou Span A crosses above Senkou Span B, and a bearish crossover happens when Senkou Span A crosses below Senkou Span B.
Traders leverage the Ichimoku Cloud to discern trend strength, market momentum, and pinpoint optimal entry and exit points. Its multifaceted approach offers a holistic view of market conditions, enabling traders to navigate various market landscapes with informed precision.
Moving Averages
Moving averages are widely used to identify trends and smooth out price fluctuations over a specific period.
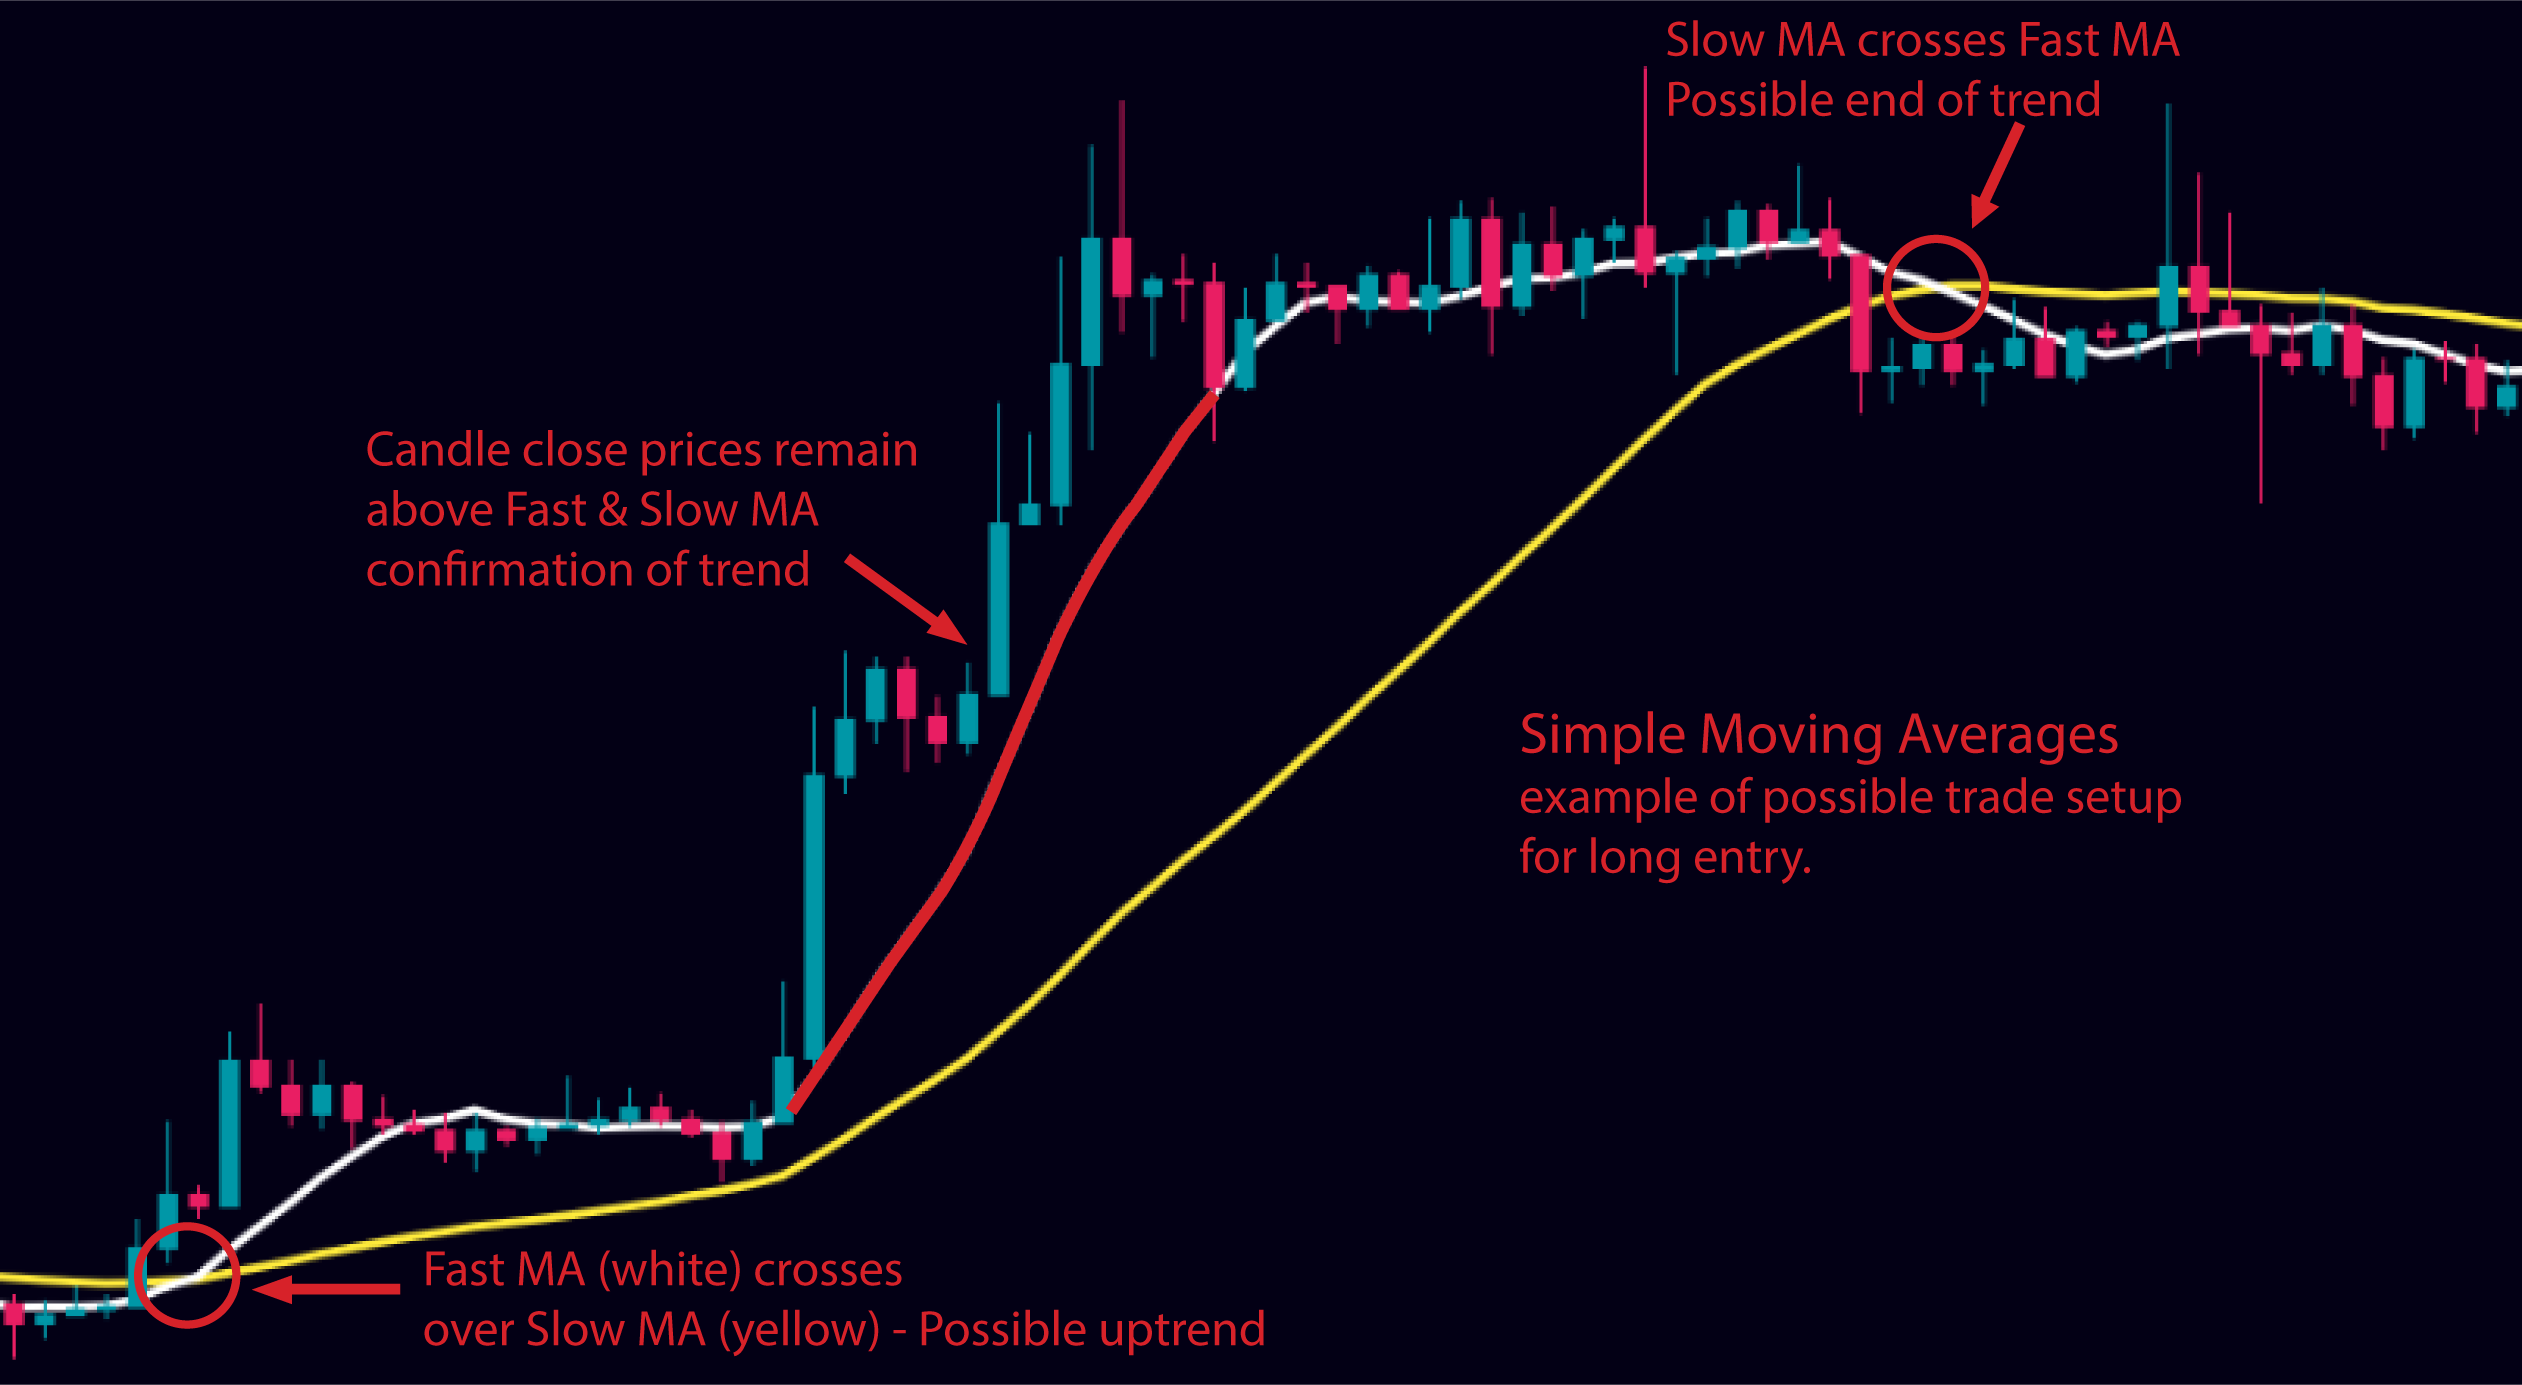 By calculating the average closing price over a chosen time frame, moving averages provide a clearer picture of the overall price direction.
- Traders commonly employ different types of moving averages, such as the simple moving average (SMA) or the exponential moving average (EMA), to generate buy or sell signals. Crossovers between shorter-term and longer-term moving averages are often seen as potential entry or exit points.
MACD (Moving Average Convergence/Divergence)
The Moving Average Convergence Divergence (MACD) is a trend-following momentum indicator, quintessential for traders to decipher the speed and strength of price movements. It’s constructed by subtracting the 26-period Exponential Moving Average (EMA) from the 12-period EMA, resulting in the MACD line. A Signal Line, the 9-period EMA of the MACD, is then plotted above it. Note that the values for the periods can be adjusted to fit a given market.
- The MACD Line crossing above the Signal Line is interpreted as a buy signal, indicating the potential onset of a bullish trend, while the MACD Line crossing below the Signal Line is viewed as a sell signal, signaling a possible bearish reversal.
- When the MACD is above zero, it signifies that the 12-period EMA is above the 26-period EMA, pointing to upward momentum. Conversely, a MACD below zero indicates that the 12-period EMA is below the 26-period EMA, reflecting downward momentum.
- Traders frequently observe for divergences between MACD and price as they can signify potential trend reversals. A divergence occurs when the price reaches a new high (or low) but the MACD doesn’t, hinting at weakening momentum.
Traders predominantly use the MACD indicator to recognize potential entry or exit points based on the crossover of the MACD and Signal Lines. It is notably effective for identifying short-term trend changes and can be pivotal in signaling the initiation, strength, and continuation of trends, allowing traders to make informed decisions in diverse market conditions.
RSI (Relative Strength Index)
RSI is a momentum oscillator that helps traders assess the strength and speed of price movements.
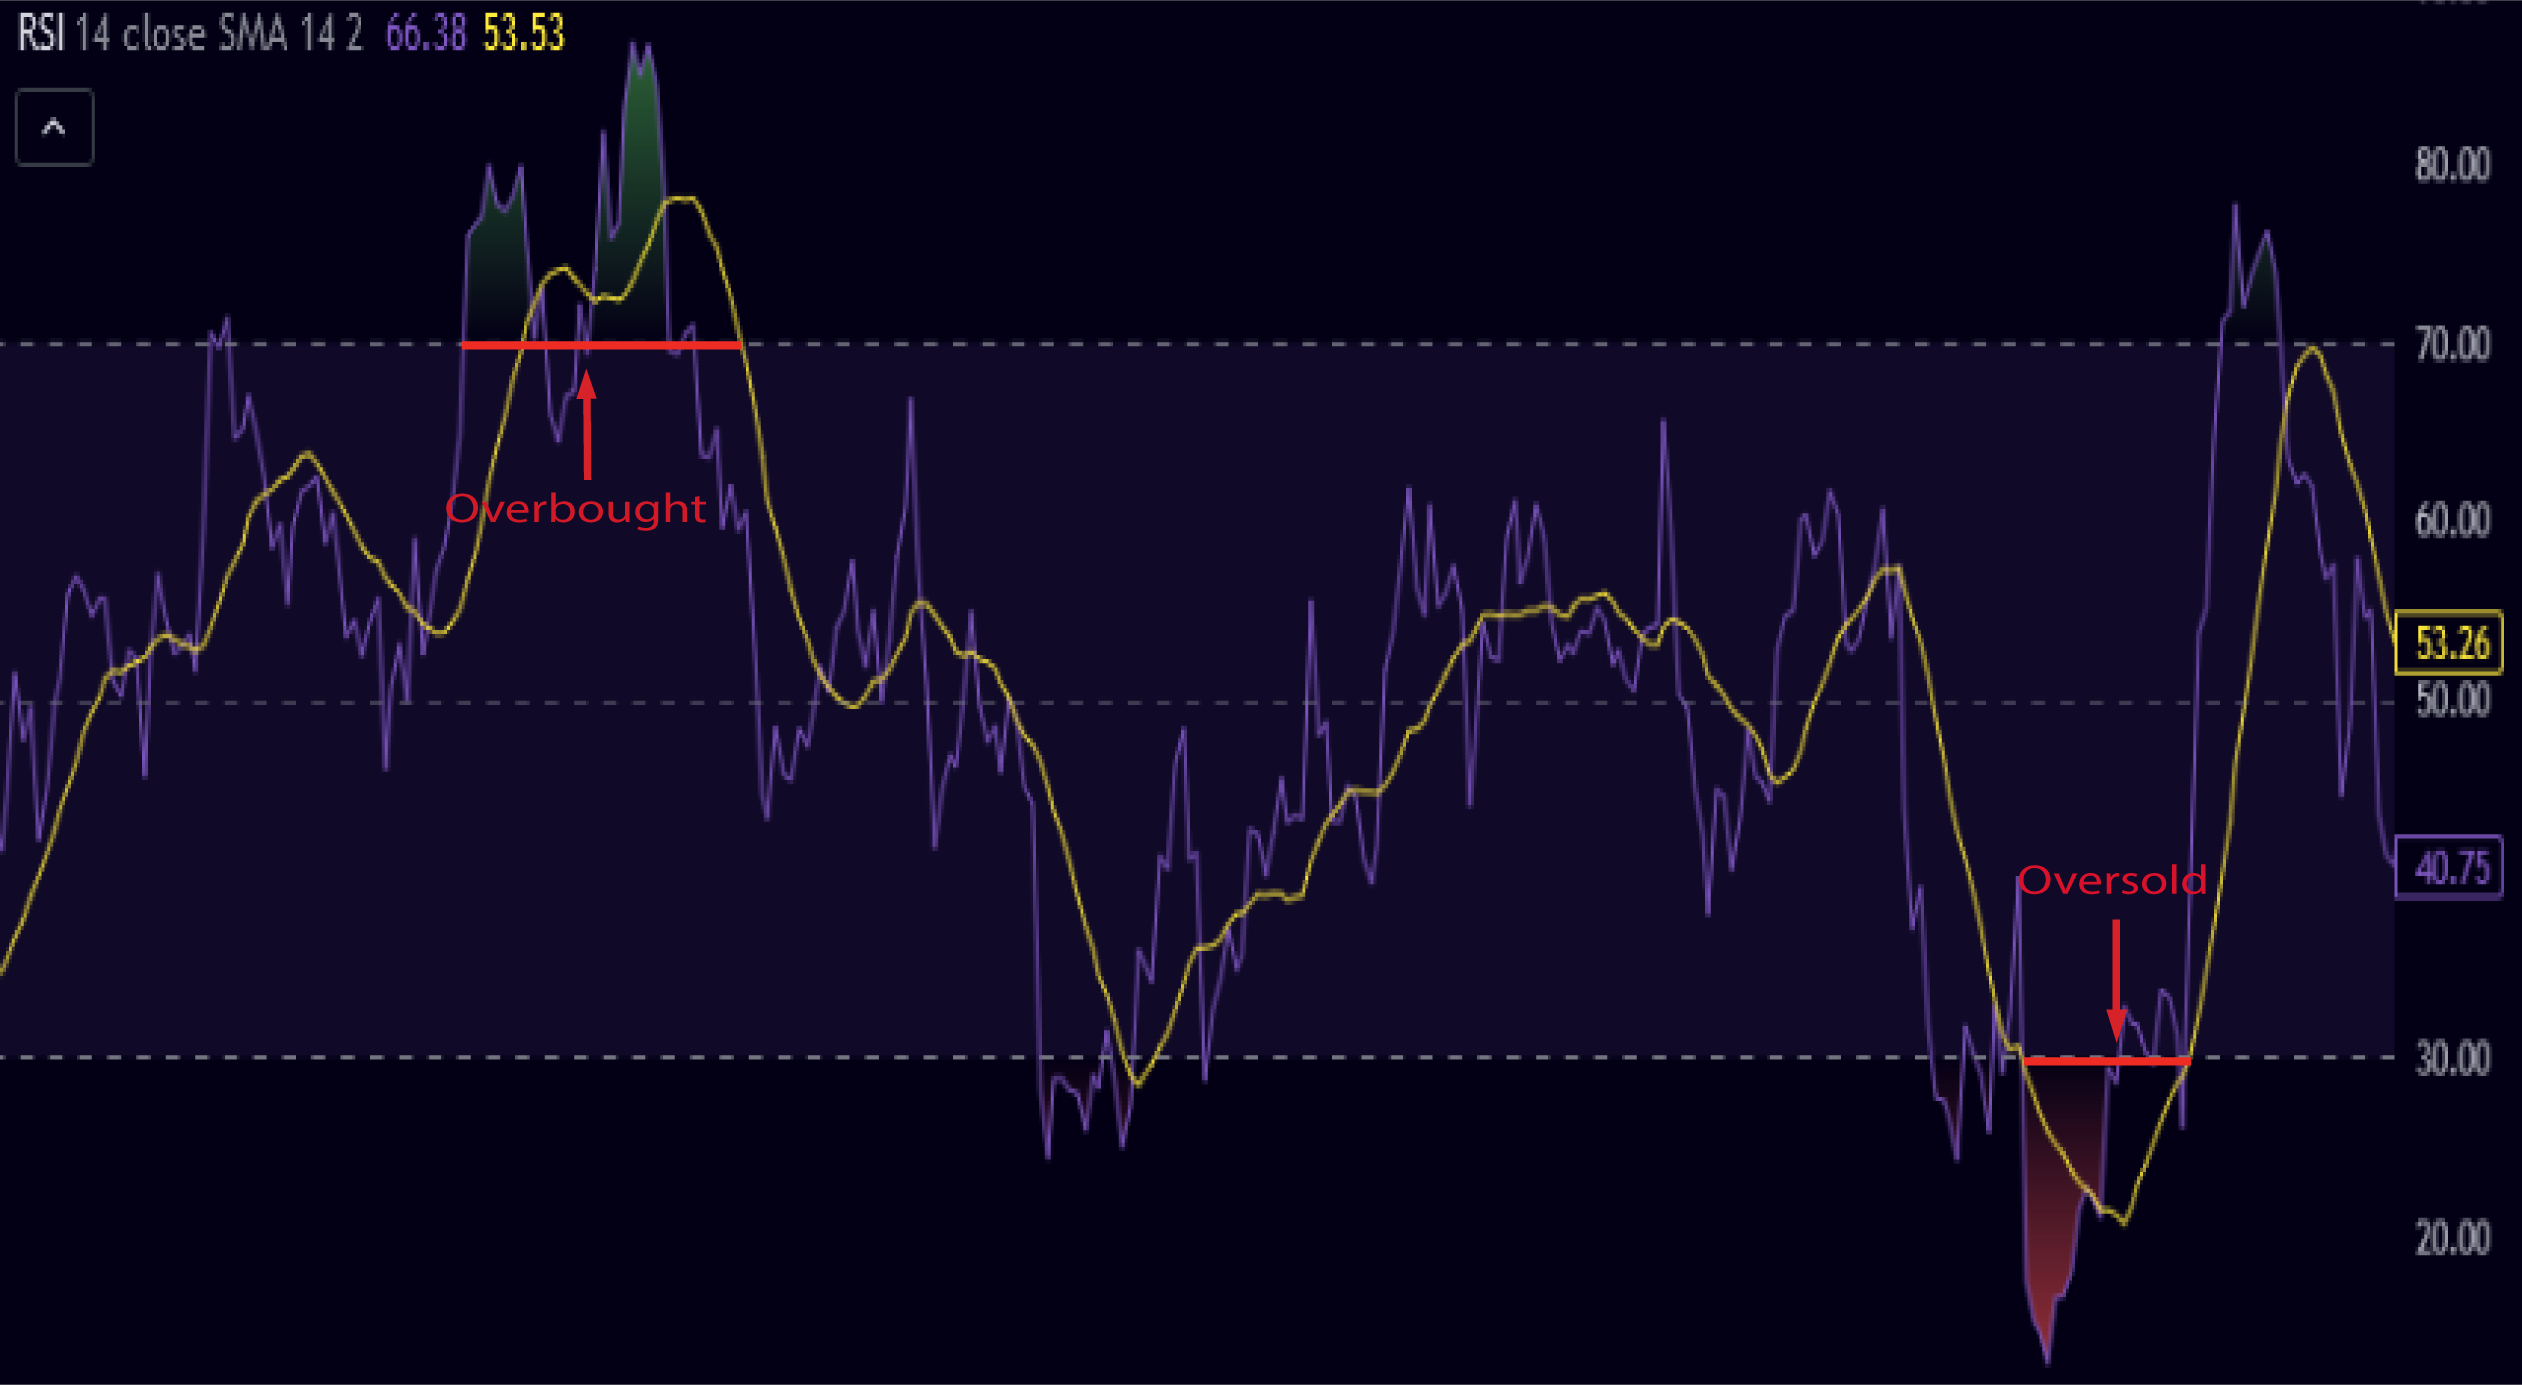 It ranges from 0 to 100 and identifies overbought and oversold conditions. The RSI measures the magnitude of recent price changes and can indicate potential trend reversals. When the RSI surpasses the 70 level, it suggests overbought conditions and a possible price correction. Conversely, an RSI below 30 indicates oversold conditions and a potential rebound.
- Traders commonly use RSI to confirm trend strength and identify potential entry or exit points.
- Traditionally, values over 70 are considered to be in the overbought region, with an expectation for the RSI to return to equilibrium soon. Values under 30 signify an oversold market, again signaling a potential reversal to equilibrium.
Aroon Indicator
The Aroon Indicator is a powerful tool used by traders to identify the strength and direction of price trends. It is an oscillator like RSI. Developed by Tushar Chande, it consists of Aroon Up and Aroon Down, each ranging from 0 to 100, pinpointing whether the price is hitting new highs or lows, hence signaling the emergence or exhaustion of trends.
- Aroon Up denotes the strength of an uptrend, and Aroon Down represents the strength of a downtrend. When Aroon Up crosses above Aroon Down, it suggests the onset of a potential uptrend, and the reverse implies a potential downtrend.
- High values near 100 on either component indicate a strong trend in the respective direction, while values close to 0 imply a lack of trend or a consolidative phase.
Traders utilize the Aroon Indicator to confirm trend strength and to determine optimal entry or exit points in the market. A market is perceived in a strong uptrend when the Aroon Up is above 70, and in a strong downtrend when the Aroon Down is above 70. Low values on both components can signal a potential consolidation, alerting traders to anticipate a breakout in either direction.
Stochastic Oscillator
The Stochastic Oscillator is a momentum indicator that compares a security's closing price to its price range over a specific period.
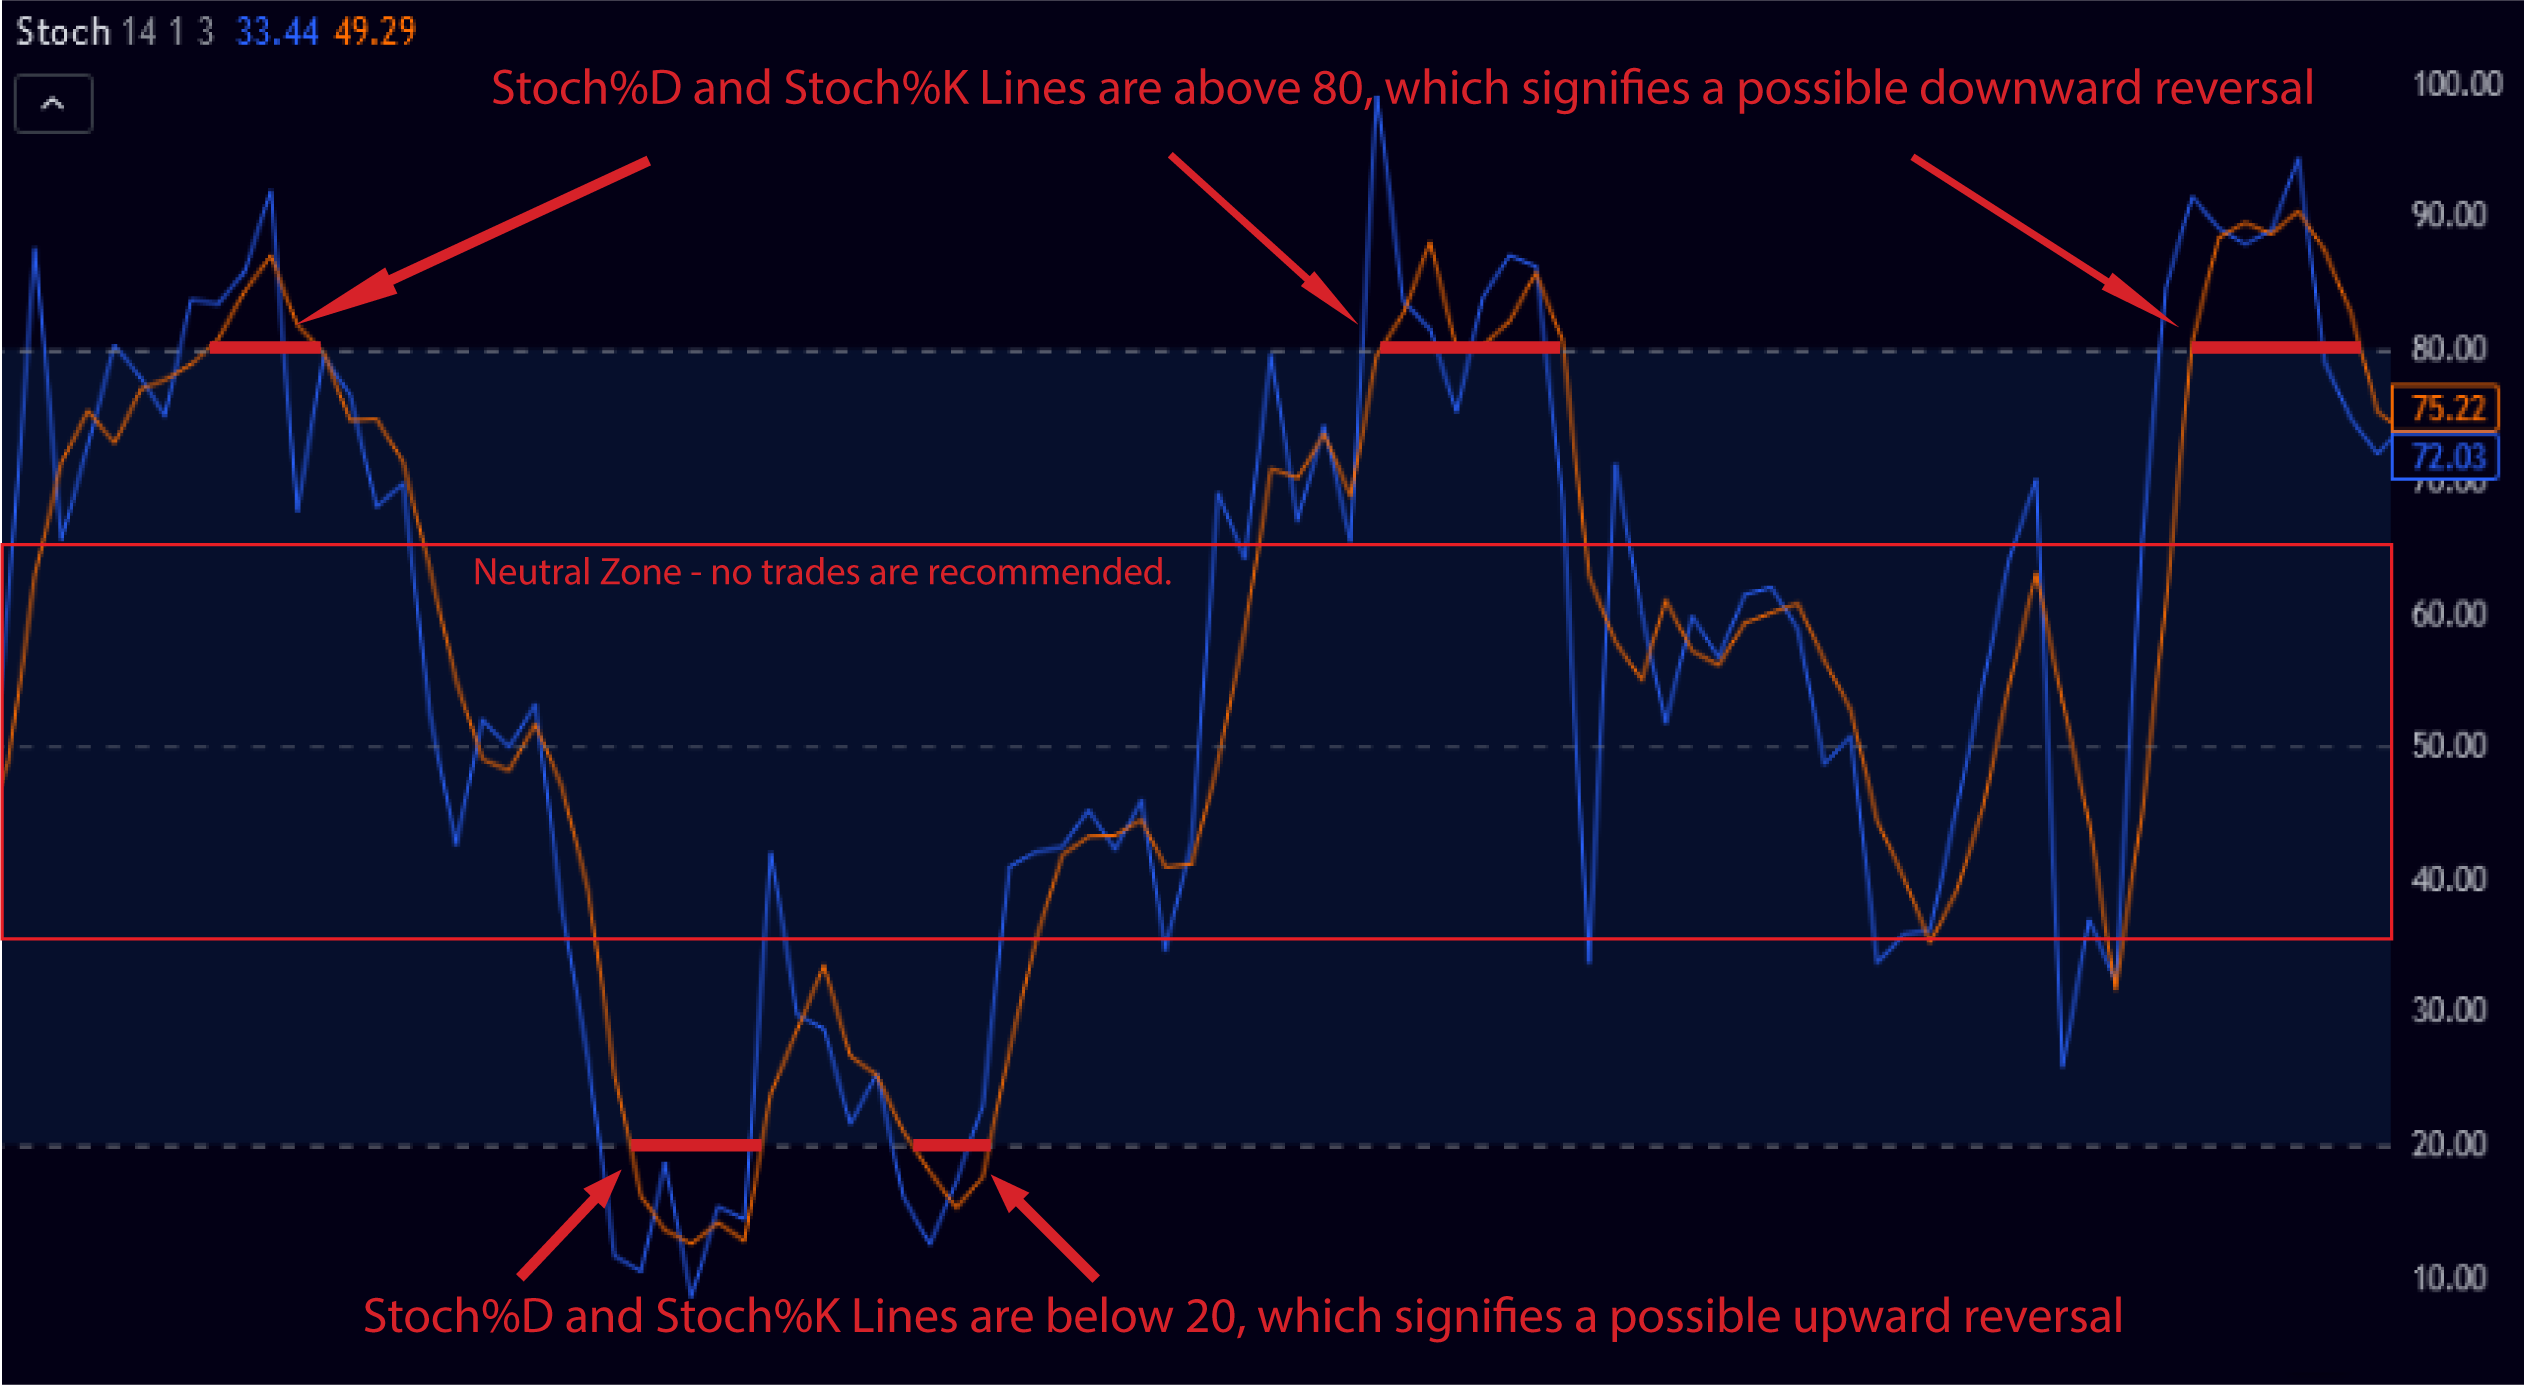 It consists of two lines, %K and %D, which oscillate between 0 and 100. The %K line represents the current price relative to the price range, while the %D line is a moving average of %K.
- Traders use the stochastic oscillator to identify overbought and oversold conditions. Readings above 80 suggest overbought conditions, potentially indicating a reversal or price pullback, while readings below 20 indicate oversold conditions, suggesting a possible price bounce.
On-Balance Volume (OBV)
The On-Balance Volume (OBV) is a crucial momentum indicator that allows traders to gauge the flow of volume in relation to price movement, reflecting the buying and selling pressure. It’s calculated by adding the day’s volume to a cumulative total when the price closes up, and subtracting the day’s volume when the price closes down.
- A rising OBV suggests that volume is flowing in on days when the price is higher, indicative of accumulation or buying pressure. Conversely, a falling OBV denotes that the volume is higher on days with lower closing prices, signaling distribution or selling pressure.
- When the price is rising but OBV is falling, it can indicate potential weakness and a possible trend reversal. Conversely, if the price is falling but OBV is rising, it could signal strength and a potential upward reversal. This is noted as a divergence between price and volume.
Traders commonly employ OBV to confirm trends and spot potential reversals, using it as a signal for entry or exit points. Discrepancies between OBV and price movement can provide vital clues about underlying strength or weakness in the price trend, aiding traders in making well-informed decisions in various market scenarios.